
SDA II
Unleash the power of serial data analysis to understand and characterize your design, prove compliance, and determine why a device or host fails compliance.
- Integrated jitter and timing analysis for clock and data signals
- Many plot types for jitter and eye diagram analysis including: Eye Diagram, IsoBER, DDj Plot, Digital Pattern, DDj Histogram, Jitter Track, PLL Track, Jitter Spectrum (with peak annotation), Spectrum Threshold, Pj Inverse FFT, Jitter Histogram, CDF, Bathtub, and NQ-Scale
- IsoBER displays the lines of constant Bit Error Ratio
- Configurable software PLL uses up to two poles for non-standard clock requirements
- Two jitter breakdown methods (Spectral and NQ-Scale) indicate pathological jitter measurement conditions
- LeCroy’s quick view displays the eye diagram, TIE track, bathtub curve, jitter histogram, NQ-scale, and jitter spectrum all on the screen at the same time
- Create Eye Patterns utilizing the full memory for maximum statistical significance
- Complete Data Dependent Jitter (DDj) decomposition with histograms, plots, and InterSymbol Interference (ISI) parameters and plots
- Complete Random Jitter (Rj) + Bounded Uncorrelated Jitter (Buj) views include Histogram, Spectrum and Track
- Complete Period Jitter (Pj) analysis with a time domain view of Pj (Pj Inverse FFT)
Unleash the power of serial data analysis to understand and characterize your design, prove compliance, and determine why a device or host fails compliance.
But how do you determine why a device fails compliance? LeCroy’s SDA II serial data debug software is the most powerful and versatile solution for finding the root cause of serial data compliance failures. SDA II provides the confidence you need to ensure proper functionality.
SDA II Advanced Debug for Eye and Jitter AnalysisThe SDA II analysis package is the only solution that fully integrates jitter measurements into the oscilloscope software leading to greater confidence in jitter measurements.
New features such as IsoBER add insight to the traditionally non-quantitative view of eye openings, while Dual-Eye View Modes and the ability to Show Mask Failures help you to quickly identify sources of eye failures.
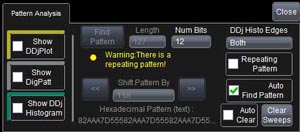
In addition, properly distinguishing between the Rj and Dj in a serial data signal is a crucial part of reducing overall jitter. For example, the Periodic Jitter Spectrum allows the user to accurately identify the frequencies where periodic jitter (Pj) occurs and the DDj Histogram displays the distribution of the Data Dependent Jitter (DDj). These new features provide the highest level of insight into possible jitter sources.
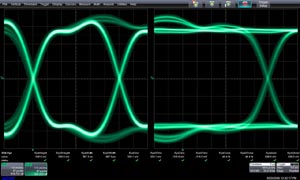
Dual-Eye View ModeViewing the transition and nontransition eye diagrams allow for analysis of de-emphasis in serial data waveforms. In addition, the Dual-Eye Gated mode or view enables the creation of two separate eyes based on two separate signal inputs (I.e. Read/Write).
Show Mask Failures
Mask failures can be highlighted with red circles showing the exact points where the data intersects the mask. Additionally, the number of these failures is available as a parameter, which is useful for automation. Masks for many standards are included, and can be stretched vertically and/or horizontally to provide testing with margin.

Mask testing is not always the best way to determine if the signal meets Bit Error Rate requirements because it lacks quantitative analysis of vertical noise and jitter. LeCroy’s unique IsoBER analysis tool provides quantitative analysis by extrapo lating the eye diagram data and displaying the lines of BER directly on the eye. This helps to quickly determine the minimum eye opening and is instrumental in detecting cross-talk by analyzing the vertical eye closure. These measurements are not possible with standard eye diagram techniques.

The sources of jitter can be categorized as Deterministic or Random, which is an important distinction in calculating the Total Jitter (Tj) of a signal. There are cases where cross-talk, or other types of Dj, can masquerade as random jitter and cause incorrect calculations.
LeCroy’s integrated SDA II jitter analysis offers two decomposition algorithms accounting for these situations. These algorithms provide confidence that all jitter components are accurately recognized and processed correctly. Jitter decomposition calculates both methods simultaneously and alerts you when there is a deviation between the results.
Intuitive Jitter Breakdown DisplaysLeCroy’s SDA II Serial Data Analysis provides intuitive views of jitter decomposition for fast root cause insight.
SDA II provides the following tools for understanding Dj values and sources:
- DDJ Histogram provides a greater understanding of the distribution of Data Dependent Jitter (DDj)
- Periodic Jitter Spectrum identifies the sources containing the highest value of Pj.
- Eye Diagram displays a visual representation of the total jitter (Tj) of the system.
- ISI Plot ISI Plot isolated bit patterns that contribute to the most Intersymbol Interference (ISI).

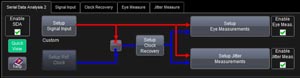
Green / Yellow / Red setup warning indicators alert when something requires your attention. For example, if the input signal is a clock and you have not selected clock as the signal type, a yellow indicator informs you that setup inconsistencies may require attention.
The SDA II analysis package is the only solution that helps you identify the cause of problems, to help you solve problems quickly.
Flow Diagram User InterfaceEye and jitter analysis in the SDA II or SDA 7 Zi begins with a simple, interactive flow diagram that intuitively guides you through the setup of Eye Measurements, Jitter Measurements, or both at the same time.
SDA II has the ability to display all of the eye parameters and jitter parameter at the same time while simultaneously displaying the standard measurement table. All of the pertinent measurements can be displayed on one screen to allow for faster debugging.

The ISI plot shows data-dependent jitter contributions to the eye pattern for the second-to-last bit of a bit length, set from 3 to 12. This plot is based on averages of bit patterns and therefore provides a view of the eye diagram without any noise on the signal.
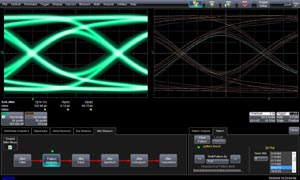
SDA II provides unique display modes that allow maximum flexibility in the positioning of the eye diagram and jitter analysis plots. This allows you to put what you want where you want.

- The jitter spectrum plot allows viewing of any periodic jitter
- Peak annotation displays the frequencies directly on the spectrum
- The LeCroy spectrum plot allows viewing of the spectrum with DDj components removed for maximum comprehension

- Time domain view of jitter shows transient jitter events that cannot be observed by viewing the jitter histogram
- The jitter trend clearly shows any non-stationary jitter behavior
- Measured jitter histogram clearly displays unusual jitter distributions like bi-modal or non-Gaussian tails. The raw data view shows possibly lost jitter behavior just by viewing the jitter breakdown
- This unprocessed display gives a high degree of confidence in the accuracy of the jitter breakdown and bathtub curve
- Eye pattern measurement on up to 8 million consecutive bits captures transient jitter and noise events
- Consecutive bit eye pattern analysis allows for the measurement of the wave shapes of individual bits that violate the compliance mask
- Fast UI accumulation and very low jitter noise floor (for example, 400 fs typical for WaveMaster 816Zi)
SDA II Serial Data Analysis Software(Standard on SDA 8 Zi, SDA 7 Zi, DDA 8 Zi and DDA 7 Zi)
Total JitterA complete toolset is provided to measure total jitter. Eye Diagrams withmillions of UI are quickly calculated from up to 512 Mpts records, andadvanced tools may be used on the Eye Diagram to aid analysis. CompleteTIE and Total Jitter (Tj) parameters and analysis functions are provided.
- Time Interval Error (TIE) Measurement Parameter, Histogram, Spectrum and Jitter Track
- Total Jitter (Tj) Measurement Parameter, Histogram, Spectrum
- Eye Diagram Display (sliced)
- Eye Diagram IsoBER (lines of constant Bit Error Rate)
- Eye Diagram Mask Violation Highlight and Statistics
- Eye Diagram Measurement Parameters
- Eye Height
- One Level
- Zero Level
- Eye Amplitude
- Eye Width
- Eye Crossing
- Avg. Power
- Extinction Ratio
- Mask Hits
- Mask Out
- Bit Error Rate
- Slice Width (Setting)
- Q-Fit Tail Representation
- Bathtub Curve
- Cumulative Density Function (CDF)
- PLL Track
Two jitter decomposition methods are provided and simultaneously calculated to provide maximum measurement confidence. Q-Scale, CDF, Bathtub Curve, and all jitter decomposition measurement parameters can be displayed using either method.
- Spectral Method*
- NQ-Scale Method*
*For more information about the differences between the Spectral and NQ-Scale methods of jitter decomposition please refer to: http://www.lecroy.com/tm/library/appnotes/sdaii/understanding_sda_ii_jitter_calculation_methods.pdf
Random Jitter (Rj) and Non-Data Dependent Jitter (Rj+Buj)- Random Jitter (Rj) Measurement Parameter
- Rj+Buj Histogram
- Rj+Buj Spectrum
- Rj+Buj Track
- Deterministic Jitter (Dj) Measurement Parameter
- Data Dependent Jitter (DDj) Measurement Parameter
- DDj Histogram
- DDj Plot (by Pattern or N-bit Sequence)
 我要赚赏金
我要赚赏金 STM32
STM32 MCU
MCU 通讯及无线技术
 物联网技术
物联网技术 电子DIY
电子DIY 板卡试用
板卡试用 基础知识
基础知识 软件与操作系统
 我爱生活
我爱生活 小e食堂
小e食堂

