
1、调试原理
GDB调试是应用程序在开发板上运行,然后在PC机上对开发板上得应用程序进行调试,PC机运行GDB,开发板上运行GDBServer。在应用程序调试的时候,pc机上的gdb向开发板上的GDBServer发出命令,而开发板上的gdbserver就会向应用程序发出信号,使应用程序停下来或者完成其他一些工作。
2、安装GDB和GDBServer(gdb-7.4.tar.bz2 )
2.1、GDB
1、下载: http://ftp.gnu.org/gnu/gdb/
2、解压:tar xvf gdb-7.4.tar.bz2
3、配置:cd gdb-7.4/
./configure --target=arm-linux
4、编译:make
5、安装:mkdir tmp
make install prefix=$PWD/tmp
6、拷贝:cp tmp/bin/arm-linux-gdb /bin/
7、查看版本 /bin/arm-linux-gdb -v (使用绝对路径使用gdb)
2.2、GDBServer
1、cd gdb/gdbserver/
2、配置: 。/configure --target=arm-linux --host=arm-linux
3、编译: make CC=arm-linux-gcc
2.3、编译GDBServer的时候会出现以下错误
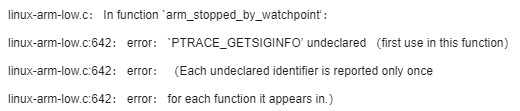
该错误是因为找不到PTRACE_GETSIGINFO宏,导致编译错误。我们到交叉编译链去搜索一下,我们交叉编译地址为 /work/tools/gcc-3.4.5-glibc-2.3.6
# cd /work/tools/gcc-3.4.5-glibc-2.3.6
# grep “PTRACE_GETSIGINFO” * -nR
arm-linux/sys-include/linux/ptrace.h:27:#define PTRACE_GETSIGINFO 0x4202
arm-linux/include/linux/ptrace.h:27:#define PTRACE_GETSIGINFO 0x4202
distributed/arm-linux/sys-include/linux/ptrace.h:27:#define PTRACE_GETSIGINFO 0x4202
distributed/arm-linux/include/linux/ptrace.h:27:#define PTRACE_GETSIGINFO 0x4202
可以看到,在交叉编译链里面,定义了PTRACE_GETSIGINFO宏为0x4202,头文件为include《linux/ptrace.h》中。
有两种解决办法,可任选其一:
① 在linux-arm-low.c中直接添加宏 #define PTRACE_GETSIGINFO 0x4202
② 在linux-arm-low.c中将#include 《sys/ptrace.h》 更改为 #include 《linux/ptrace.h》
再次编译,编译通过。
2.4、将gdbserver拷贝到开发板的bin目录下
#cp gdbserver /work/nfs_root/first_fs/bin
3、调试
3.1、在编译要进行调试的应用程序 加上 -g
测试程序如下(test_debug.c)
#include 《stdio.h》
void C(int *p)
{
*p = 0x12;
}
void B(int *p)
{
C(p);
}
void A(int *p)
{
B(p);
}
void A2(int *p)
{
C(p);
}
int main(int argc, char **argv)
{
int a;
int *p = NULL;
A2(&a); // A2 》 C
printf(“a = 0x%x\n”, a);
A(p); // A 》 B 》 C
return 0;
}
编译:
#arm-linux-gcc -g -o test_debug test_debug.c
3.2、在开发板上:
打印出如下信息:
#gdbserver 192.168.1.10:123 。/test_debugProcess 。/test_debug created; pid = 751
Listening on port 2345
注释:192.168.1.10:本开发板的ip
123:端口号,自己随便写的
/test_debug:要调试的程序
3.3、在PC上输入:
/bin/arm-linux-gdb 。/test-debug
target remote 192.168.183.127:2345
3.4、正式调试!介绍几个常用的命令
(1)l:列出所有源代码
(2)break main:在main处打断点
break test_debug.c:11:在test_debug.c的11行打断点
(3)c:运行到断点处
(4)step:单步执行
(5)next:单步执行,但是step会进入函数里面,但是next不会
(6)print a:打印a这个变量的值
(7)quit:退出,输入此命令则开发板上的gdbserver也退出
(8) 详细的GDB调试命令
4、另外一种调试方法
让程序在开发板上直接运行,当它发生错误时,令它产生core dump文件,然后使用gdb根据core dump文件找到发生错误的地方
在ARM板上:
4.1、 ulimit -c unlimited
4.2、 执行应用程序 : 程序出错时会在当前目录下生成名为core的文件
在PC上:
4.3、首先将core文件拷贝到pc机上
然后:/bin/arm-linux-gdb 。/test_debug 。/core
打印出如下信息:
GNU gdb (GDB) 7.4
Copyright (C) 2012 Free Software Foundation, Inc.
License GPLv3+: GNU GPL version 3 or later 《http://gnu.org/licenses/gpl.html》
This is free software: you are free to change and redistribute it.
There is NO WARRANTY, to the extent permitted by law. Type “show copying”
and “show warranty” for details.
This GDB was configured as “--host=i686-pc-linux-gnu --target=arm-linux”。
For bug reporTIng instrucTIons, please see:
《http://www.gnu.org/software/gdb/bugs/》。..
Reading symbols from /home/share/jz2440/test_debug.。.done.
[New LWP 748]
warning: `/lib/libc.so.6‘: Shared library architecture unknown is not compaTIble with target architecture arm.
warning: `/lib/ld-linux.so.2’: Shared library architecture unknown is not compaTIble with target architecture arm.
Core was generated by `。/test_debug‘。
Program terminated with signal 11, Segmentation fault.
#0 0x000084ac in C (p=0x0) at test_debug.c:6
6 *p = 0x12;
4.4、bt:可以显示调用关系
#0 0x000084ac in C (p=0x0) at test_debug.c:6
#1 0x000084d0 in B (p=0x0) at test_debug.c:12
#2 0x000084f0 in A (p=0x0) at test_debug.c:17
#3 0x00008554 in main (argc=1, argv=0xbeb32eb4) at test_debug.c:34
 我要赚赏金
我要赚赏金 STM32
STM32 MCU
MCU 通讯及无线技术
 物联网技术
物联网技术 电子DIY
电子DIY 板卡试用
板卡试用 基础知识
基础知识 软件与操作系统
 我爱生活
我爱生活 小e食堂
小e食堂

