
The LeCroy QPHY-DDR3 Test Solution is the best way to characterize DDR3 memory interfaces. Capable of performing measurements on 800 MHz, 1066 MHz, 1333 MHz, 1600 MHz and custom speed grades, QPHY-DDR3 has a full suite of Clock, Electrical and Timing tests as specified by the JEDEC Specification.
- Fastest way to gain confidence in your DDR3 interface by measuring a large number of cycles and reporting statisticaly relevant results
- Fully annotated worst case measurement screenshot captured and displayed in report including trace labels and pertinent voltage levels
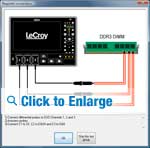
- Ability to use the CS line to separate read signals from write signals in multi-ranked systems
- Stop on test/failure capabilityallows the user to pause at a particular test and review the measurement on the oscilloscope display
- Support for testing 800 MHz, 1066 MHz, 1333 MHz, 1600 MHz and custom speed grades of DDR3 signals
- Test coverage for tests as described by the JESD79-3D JEDEC specification
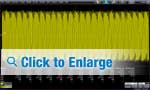
Due to the high level of variability in DDR3 measurements, it is important to measure a large number of cycles. By measuring a large number of cycles in a very short period of time, the user can be more confident that they are catching the true maximum and minimum points for their measurement. In many cases, QPHY-DDR3 will perform several thousand measurements in the same time competitive equipment will perform less than 100. This allows you to achieve statistical relevance in a single run of QPHY-DDR3 without requiring multiple acquisitions over a long period of time.
Advanced Debug CapabilityUsing the “Stop on Test” capability built in to QPHY-DDR3, the user can pause the testing at the completion of each individual test. QPHY-DDR3 will prompt the oscilloscope to save the panel file to preserve the current state of the oscilloscope. The user is then free to perform additional debugging of any particular test to aid root cause analysis. Root causes of failure can be quickly and easily found using all of the advanced serial data tools within the oscilloscope. These include: SDA II, Eye Doctor™ II, WaveScan™, Histograms, Tracks and many more - making it easy to correlate anomalies with other observed behaviors. Once the user has completed debugging that particular test, they simply click on the “Ok” button in QPHY-DDR3 to resume running the remainder of the selected tests.
These tests perform all of the clock tests as described by the appropriate JEDEC specification. These include average clock period, absolute clock period, average high/low pulse width, absolute high/low pulse width, half period jitter, clock period jitter, cycle-to-cycle period jitter and cumulative error over n period tests.
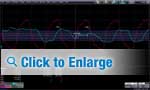
Shown above, the SRQ test measuresthe slew rates of the data, strobe and clock signals. A 2 Mpt acquisition was taken and all of the read bursts were identified. Then every rising edge slew rate was measured. In this case over 9000 slew rate measurements were performed. Shown above, the worst instance of this measurement is displayed on the screen. Additionally, the “Stop on Test” ability can be used to perform further analysis on this test to determine the root cause of a failure.
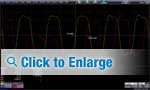
Shown above, the tDQSCK test verifies that the strobe output access time from the clock signal. Similar to the electrical tests, a 2 Mpt acquisition was taken and all of the read bursts were identified. Then the time between every strobe edge and its associated clock were measured. In this case over 10000 tDQSCK measurements were performed. Shown above, the worst instance of this measurement is displayed on the screen. An additional probe can be utilized to capture a separate signal on the board to aid in failure analysis.
Eye Diagrams are a powerful tool for debugging serial data signals. QPHY-DDR3 enables the user to create eye diagrams of both the Read and the Write data bursts to ensure that the signal integrity is sufficient such that the data will be sampled properly by the receiver. Additionally, the Eye Diagram for the Data Signal and the Strobe signal are shown at the same time to ensure proper strobe timing.
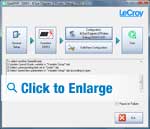
QualiPHY is designed to reduce the time, effort and specialized knowledge needed to perform compliance testing on high-speed serial buses.
- Guides the user through each test setup
- Performs each measurement in accordance with the relevant test procedure
- Compares each measured value with the applicable specification limits
- Fully documents all results
- QualiPHY helps the user perform testing the right way every time!

| Clock Tests |
| tCH(avg), Average High Pulse Width |
| tCL(avg), Average Low Pulse Width |
| tJIT(duty), Half Period Jitter |
| tCK(avg), Average Clock Period |
| tJIT(per), Clock Period Jitter |
| tJIT(cc), Cycle to Cycle Period Jitter |
| tERR(n per), Cumulative Error |
| tCK(abs), Absolute Clock Period |
| tCH(abs), Absolute Clock High Pulse Width |
| tCL(abs), Absolute Clock Low Pulse Width |
| Electrical Tests |
| SlewR |
| SlewF |
| VIH(ac) |
| VIH(dc), DC input logic HIGH |
| VIL(ac) |
| VIL(dc), dc input logic LOW |
| SRQse, Single-ended Output Slew Rate |
| SRQdiff, Differential Output Slew Rate |
| Timing Tests |
| tDQSQ, DQS-DQ Skew for DQS and Associated DQ Signals |
| tQH, DQ/DQS Output Hold Time From DQS |
| tDQSS, DQS latching rising transitions to associated clock edge |
| tDSS, DQS Falling Edge to CK Setup Time |
| tDSH, DQS Falling Edge Hold Time from CK |
| tDQSCK, DQS Output Access Time from CK/CK # |
| tDS(base), DQ and DM Input Setup Time |
| tDH(base), DQ and DM Input Hold Time |
| Advanced Debug |
| Eye Diagram of Data and Strobe on Read Cycle |
| Eye Diagram of Data and Strobe on Write Cycle |
 我要赚赏金
我要赚赏金 STM32
STM32 MCU
MCU 通讯及无线技术
 物联网技术
物联网技术 电子DIY
电子DIY 板卡试用
板卡试用 基础知识
基础知识 软件与操作系统
 我爱生活
我爱生活 小e食堂
小e食堂

